We fact-checked 51 cold outreach statistics. Three had no source.
Estimated reading time: 7 minutes
"80% of sales require at least five follow-ups." You've seen this stat, almost always credited to the National Sales Executive Association. We went looking for the study. Or rather, we went looking for the association, since the study itself is never linked. There is no website, no archive, no incorporation record, no former member. The most-quoted persistence stat in sales is credited to an organization that appears never to have existed.
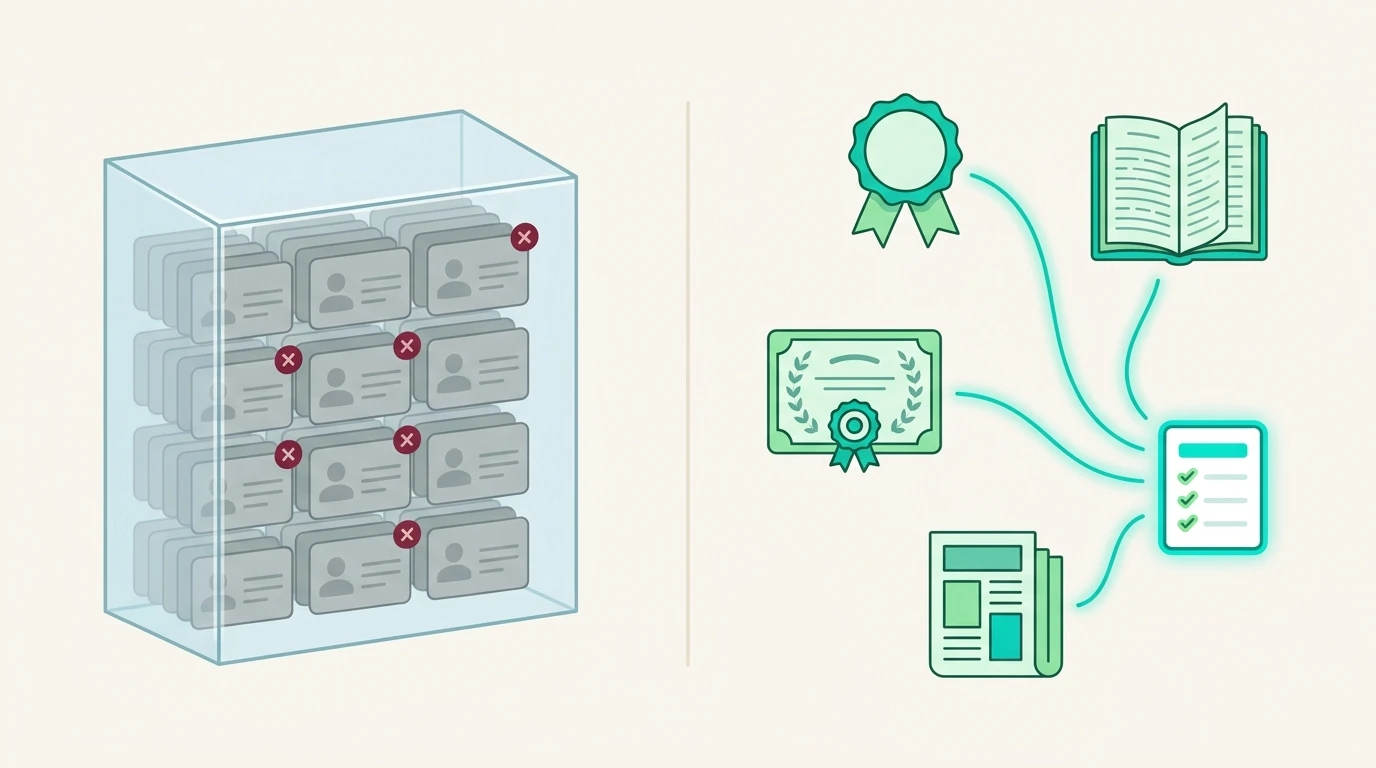
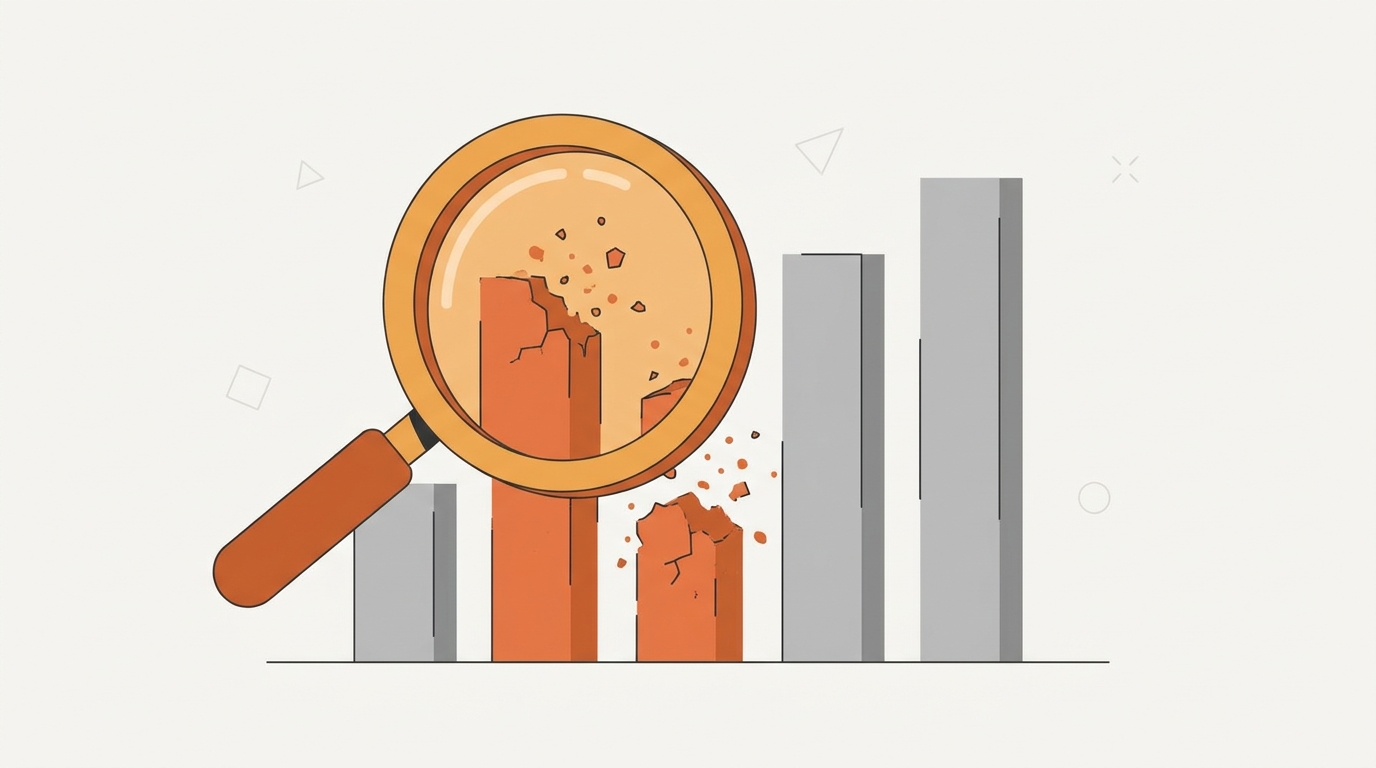
We didn't set out to debunk anything. We were building the research base for the negative-reply playbook, and before publishing we traced every load-bearing claim back to its primary source. 51 claims. 31 checked out verbatim. 15 needed corrections, usually small: a misattributed link, a wrong unit, a gloss that overstated the finding. 2 were obsolete, replaced by newer data from the same publisher. And 3 could not be traced to any document at all.
That's the canon of outbound. Two of every five famous numbers had something wrong with them.
The sales statistics nobody can trace
The Gartner one is subtler than the NSEA fabrication. "68% of tech purchases over $50K land in the first half of the buyer's fiscal year" circulates with a Gartner attribution, and the attribution is what disarms you: Gartner publishes real research, so nobody checks. We searched every Gartner document we could reach. The claim lives only in SEO glossaries that cite each other in a loop.
The real seasonality data is less tidy and more useful. HockeyStack analyzed 10,000+ closed-won deals across 28 B2B SaaS companies: close rates peak in Q4 and Q1, sag through the middle of the year, and the seasonality hits outbound hardest. Outbound-sourced deals swing 42% from Q4 to Q1. Inbound moves 4%.
Then the Woodpecker claim: "sequences of 4-7 touches beat 8+ touches by 41%." Woodpecker is a real company publishing real statistics, and this finding appears in none of its publications. We traced it to a secondary blog and no further. Woodpecker's actual finding is simpler and stronger: campaigns with 4-7 emails pulled a 27% reply rate against 9% for campaigns with 1-3.
What do the three share? A precise number, a big-name attribution, and no document. Precision plus prestige is the costume. The document is the test.
Real studies, transplanted
Outright fabrication is rare. The more common failure is a real study quoted into a context it never measured, and it's harder to catch because the citation checks out.
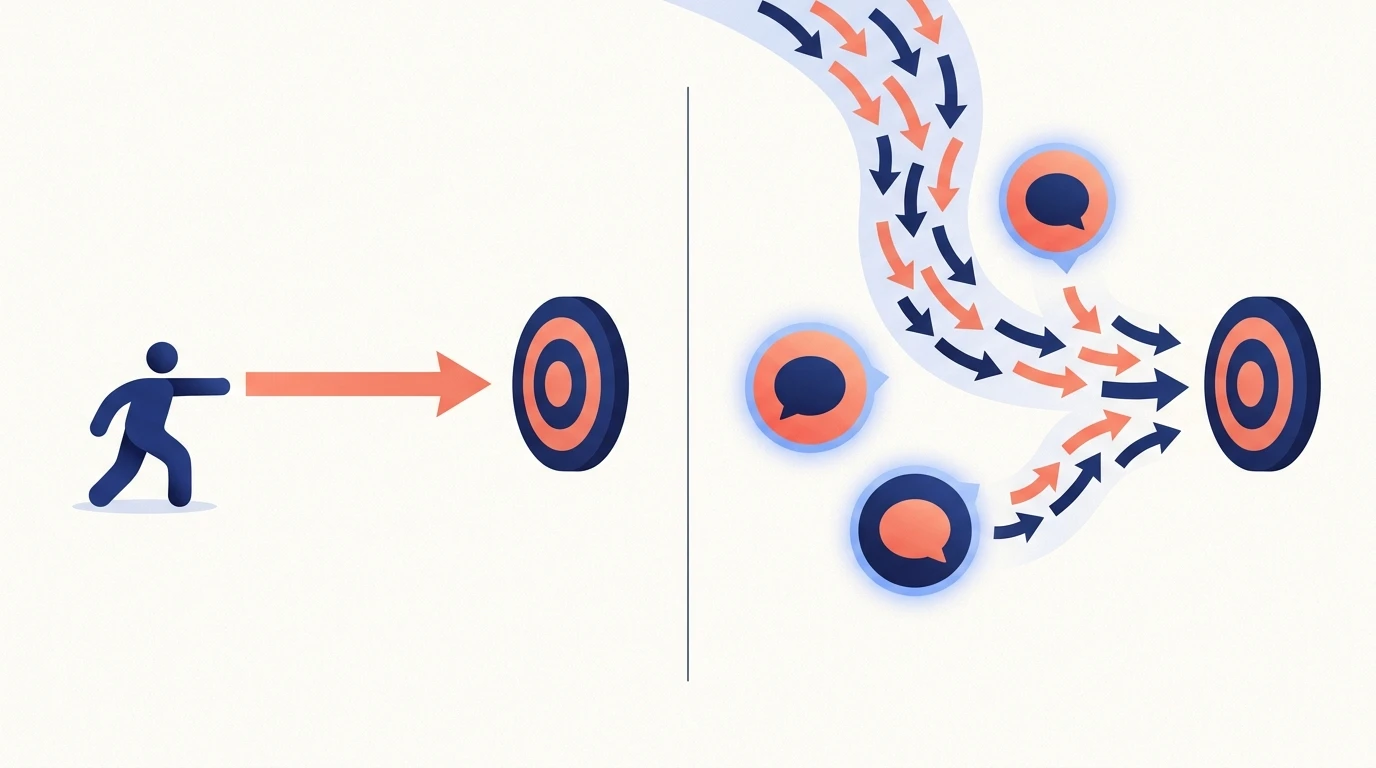
The 21x rule is the canonical case: respond to a lead within five minutes and you're 21 times more likely to qualify them. The study exists. It's the 2007 MIT/InsideSales lead-response study, and it measured inbound web-form leads worked by phone. The Harvard Business Review follow-up in 2011 (1.25 million leads: 7x within the first hour) measured inbound too. Neither says anything about cold outreach, because neither measured it. Citing them to justify a five-minute SLA on a "not interested" reply moves real evidence into a body it doesn't fit.
The outbound-specific data points the other way. CIENCE's reply-timing dataset (roughly 6 million rows) shows 19% of cold email replies arrive within the first hour and 77% within 12, so same-business-day coverage captures nearly everything. And for objections, speed can hurt: Gong's analysis of 28M+ cold emails found pitching in the reply cuts response rates by up to 57%. A careful reply this afternoon beats a defensive one in 90 seconds.
Compliance has its own transplant. The "28-day suppression window" repeated in UK cold email guides belongs to the Telephone Preference Service rule for live phone calls. The ICO's standard for email opt-outs is one word, "promptly," with no numeric deadline attached.
Two true reply-rate numbers, one wrong conclusion
Sometimes every number is accurate and the error happens in your spreadsheet.
Belkins reported a 5.8% average reply rate in 2024, measured across 16.5 million emails. Its 2026 study reports 0.45% across 7.5 million. Chart both points and you've drawn a 13x collapse in cold email. What happened is duller: the methodology changed between studies, on top of a real decline. The cliff is an artifact of mixing years that don't share a denominator.
Sales.co manages the same trap on a single page. Its reply classification (61,770 real replies) shows 14.1% of replies are positive; the same page reports a 0.64% "true positive" rate. Both are right. One divides by replies, the other by sends. Combine them and you get nonsense with two citations.
The denominator is where true statistics go to become false claims.
Anecdotes in benchmark costumes
The last failure mode involves no deception at all.
Bryan Kreuzberger's "permission to close your file?" email circulates with a 76% response rate. The entire evidentiary basis is his own first-person line in a HubSpot guest post: no sample size, no methodology, no replication. HubSpot's 33% breakup-email figure has the same shape, one enterprise account manager's self-reported result.
Both experiences may well be genuine. Neither is a benchmark. "Kreuzberger reports 76% on his own threads" is an anecdote you can weigh. "Breakup emails get 76% response rates" is a quota someone will be measured against. Attribution is the difference.
Does any of this matter?
The fair objection: most of these are directionally right. Follow-ups help, quarters matter, speed sometimes counts. If the direction is right, who cares about the decimal?
The trouble is that policies get built from the specific numbers. The 21x transplant buys a five-minute SLA that makes objection replies measurably worse. The invented five-follow-ups floor funds emails eight and nine, which buy spam complaints instead of replies. Wrong numbers become real policies, and the policies outlive the stat.
The cheat sheet: what to quote instead
| The famous claim | What we found | What to quote instead |
|---|---|---|
| "80% of sales take 5+ follow-ups" (NSEA) | The organization can't be found | Backlinko, 12M emails: one added follow-up lifts replies 65.8% |
| "68% of tech purchases close in H1 of the fiscal year" (Gartner) | In no Gartner document we could locate | HockeyStack, 10K+ deals: close rates peak Q4/Q1; outbound swings hardest |
| "Reply in 5 minutes: 21x more likely to qualify" | Real study; inbound web forms, 2007 | CIENCE, ~6M rows: 77% of cold replies arrive within 12 hours |
| "4-7 touches beat 8+ by 41%" (Woodpecker) | In no Woodpecker publication | Woodpecker's real stat: 27% vs 9% replies, 4-7 vs 1-3 emails |
| "UK law: suppress within 28 days" | That's the phone rule (TPS) | ICO on email: "promptly," no numeric deadline |
How to fact-check a sales statistic: the five-move check
Five moves, in the order that kills bad stats fastest:
- Land on the primary document. Follow the chain until the thing on your screen is the study itself. If three clicks don't get you there, treat the number as unsourced.
- Check who was measured. Inbound or outbound, calls or email, whose customers. A finding about web-form leads stays a finding about web-form leads.
- Check the denominator. "Of replies" and "of sends" can differ by two orders of magnitude. So can "of won deals" and "of all deals."
- Check the institution exists. It sounds paranoid until you remember where the five-follow-ups stat came from.
- Keep the qualifiers attached. Strip sample size, year, and population, and "27% reply rate" sounds universal. Keep them and it's a platform-specific finding you can use.
Why AI raised the stakes on bad stats
Bad stats used to spread at the speed of conference decks. Now ask an AI assistant how many follow-ups a sale takes, and there's a fair chance it hands you the NSEA number, confidently, with no attribution to check. Models learn from what circulates, what circulates is what got repeated, and what got repeated is whatever sounded most citable. The loop has no fact-checking step unless you are the step.
We keep the corrected corpus next to everything we publish now, and it changed how we read other people's numbers too. A stat with a sample size and a named methodology is a different species from a stat with a prestigious logo.
Every number you publish becomes someone else's primary source. Quote accordingly.
Sources
- Ainora - Lead response time statistics, every study. The provenance of the 21x five-minute rule, untangled study by study.
- HockeyStack - Close rates, deal sizes, and churn rates. Real quarter-boundary data: 10,000+ closed-won deals across 28 B2B SaaS companies.
- CIENCE - Best time to send cold emails. The reply arrival curve: 19% in hour one, 77% within 12 hours, across ~6M rows.
- Belkins - Cold email response rates. The 2026 study (0.45% on 7.5M emails) that replaced the 2024 methodology.
- Sales.co - Cold email statistics. 61,770 classified replies; the 14.1% vs 0.64% denominator example.
- Gong - Does cold email even work anymore?. 28M+ cold emails; pitching in the reply cuts response rates by up to 57%.
- HubSpot - The power of breakup emails. The self-reported 33% breakup response figure.
- ICO - Electronic mail marketing rules. The actual UK standard for email opt-outs: "promptly."
- Backlinko/Pitchbox - Email outreach study. 12M outreach emails; one additional follow-up lifts replies 65.8%.